Actuaries Climate Index Winter 2018–19 Data Released
Actuaries Climate Index Winter 2018–19 Data Released
Average Seasonal Values for Winter Are Increasing
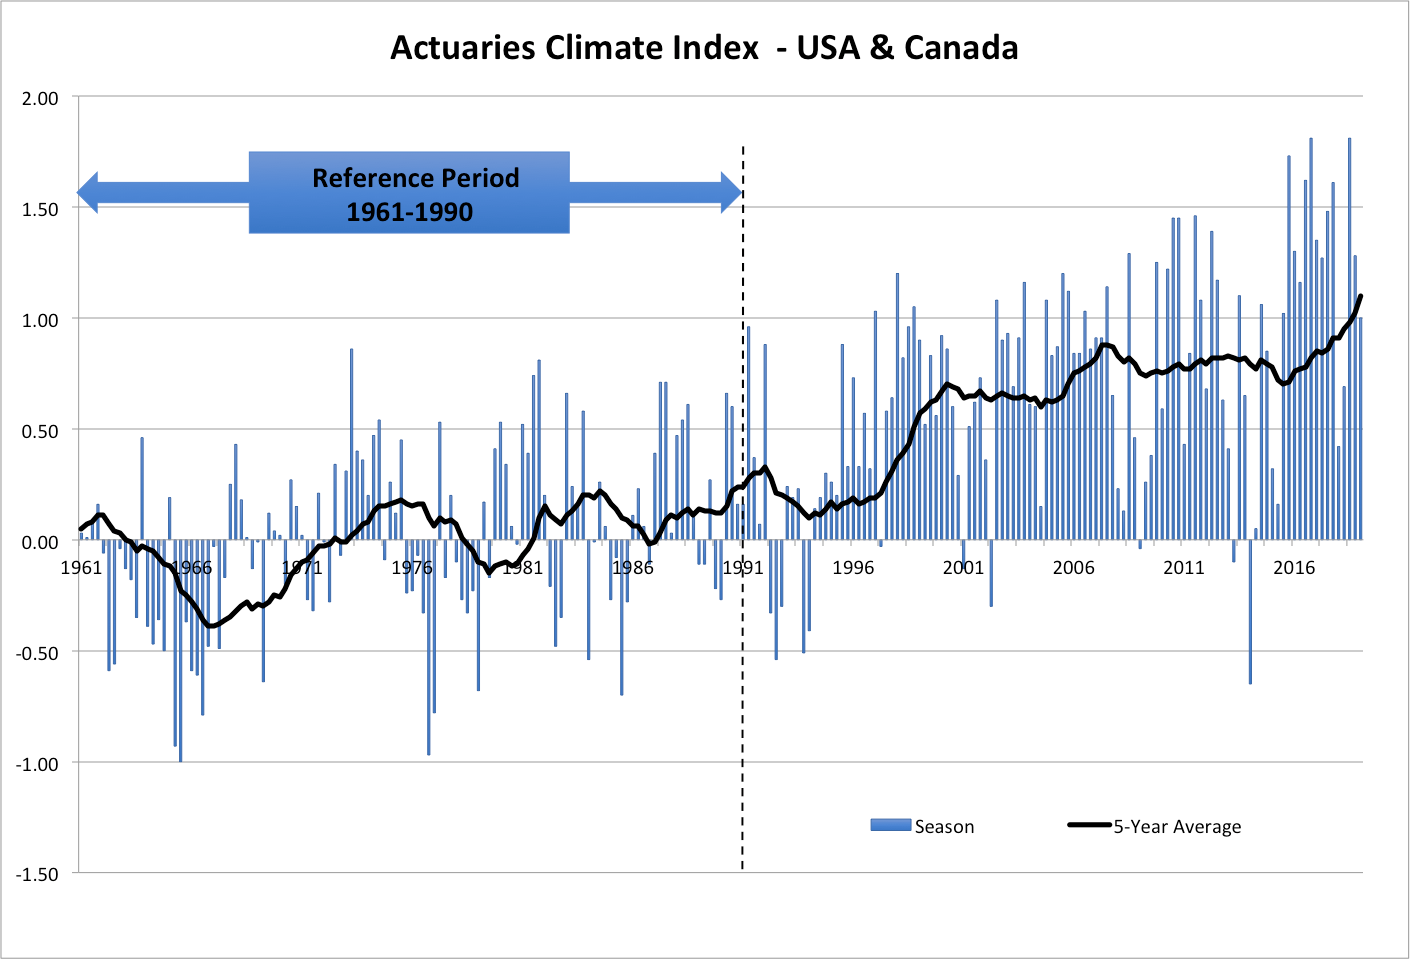
Washington, D.C., Arlington, VA, Schaumburg, IL, and Ottawa, ON (August 29, 2019)—Organizations representing the actuarial professions in Canada and the United States have updated the Actuaries Climate Index (ACI) with data from the winter of 2018–19, with the 1.00 value for the season contributing to an upward trend in the average ACI value for winter.
Taking the new data for 2018–19 into account, the average of the last five winter ACI values was higher than the average for the five winters ending in 2017–18. The increase in average winter values is one factor driving the ACI’s five-year moving average to new highs. The moving average increased by 0.08, from 1.02 to 1.10, the largest quarter-to-quarter change during the post–reference period term of the index, January 1991 to February 2019.
“Since last quarter, the ACI moving average increased by the largest amount in the post–reference period, making this five-year period the greatest outlier so far in terms of frequent extreme weather and sea level change,” says Doug Collins, Chair of the Climate Index Working Group.

The ACI is based on analysis of monthly data from neutral, scientific sources for the six different index components collected since 1961. The index measures changes in extremes of high and low temperatures, high winds, heavy precipitation, and drought, as well as changes in sea level, expressed in units of standard deviations from the mean for the 30-year reference period of 1961 to 1990 for the United States and Canada combined and by region.
The index, sponsored by the American Academy of Actuaries, the Canadian Institute of Actuaries, the Casualty Actuarial Society, and the Society of Actuaries, is designed to provide actuaries, public policymakers, and the general public with objective data about changes in the frequency of extreme climate events over recent decades.
Updated values are posted quarterly on ActuariesClimateIndex.org as data for each meteorological season becomes available. The organizations are also developing a second index, the Actuaries Climate Risk Index, to measure correlations between changes in the frequency of extreme events and economic losses, mortality, and injuries.
About the Sponsoring Organizations
The American Academy of Actuaries is a 19,500+ member professional association whose mission is to serve the public and the U.S. actuarial profession. For more than 50 years, the Academy has assisted public policymakers on all levels by providing leadership, objective expertise, and actuarial advice on risk and financial security issues. The Academy also sets qualification, practice, and professionalism standards for actuaries in the United States.
The Canadian Institute of Actuaries (CIA) is the national, bilingual organization and voice of the actuarial profession in Canada. Our 6,000+ members are dedicated to providing actuarial services and advice of the highest quality. The Institute holds the duty of the profession to the public above the needs of the profession and its members.
The Casualty Actuarial Society (CAS) is a leading international organization for credentialing and professional education. Founded in 1914, the CAS is the world’s only actuarial organization focused exclusively on property and casualty risks and serves over 8,000 members worldwide. Professionals educated by the CAS empower business and government to make well-informed strategic, financial and operational decisions.
With roots dating back to 1889, the Society of Actuaries (SOA) is the world’s largest actuarial professional organization with more than 30,000 actuaries as members. Through research and education, the SOA’s mission is to advance actuarial knowledge and to enhance the ability of actuaries to provide expert advice and relevant solutions for financial, business and societal challenges. The SOA’s vision is for actuaries to be the leading professionals in the measurement and management of risk.
###
Editor’s note: Revised October 8, 2019. Paragraphs two and three were amended to clarify that the period in question is the post–reference period, beginning January 1991. The largest quarter-to-quarter change during the reference period was 0.09 in 1981.


